I am curious about my sensors data reporting. For instance last night we had bouts of heavy rain, I am basing this on what Tempest was showing me. At times it was showing .06 rain however in the morning when I checked it only showed total of .02 and the graph never showed heavy rain only moderate and light. Am I not reading or understanding how these values are displayed/calculated?
if you have nearcast set to on, it will adjust the measured values shortly after midnight.
If you zoom in more, it might show more intense rain, as this averaged over the period per data point in the graph.
nearcast is set to on. maxed out on the zoom in on my iPad. Zoom out also doesn’t change anything.
I see the reply from tempest, gave me a better understanding.
Thank you both.
that’s odd. of course the accumulated amount shouldn’t change when zooming, but the intensity does change.
Below two graphs of the same event. The one an the left is zoomed out. The blue bar has 5 intensity steps. The one on the left has two bars of intensity 3, but if you zoom in, you can see that the bars are actually averaged versions of the bars on the right. Some higher, some lower. So if you had a short very intense rain, it would show a high peak when zoomed in, but a lower peak when zoomed out.
Btw I much prefer the rain-rate graph over this rain-graph.


i’m not sure what you are trying to say. Zoom in and scroll for example to 1:15 AM on the 18th. What is disappearing?
When I dine it goes back to the current time/day.
No worries probably how iPad is functioning.
Thanks though
Try the Rain Rate graph that @sunny referred to.
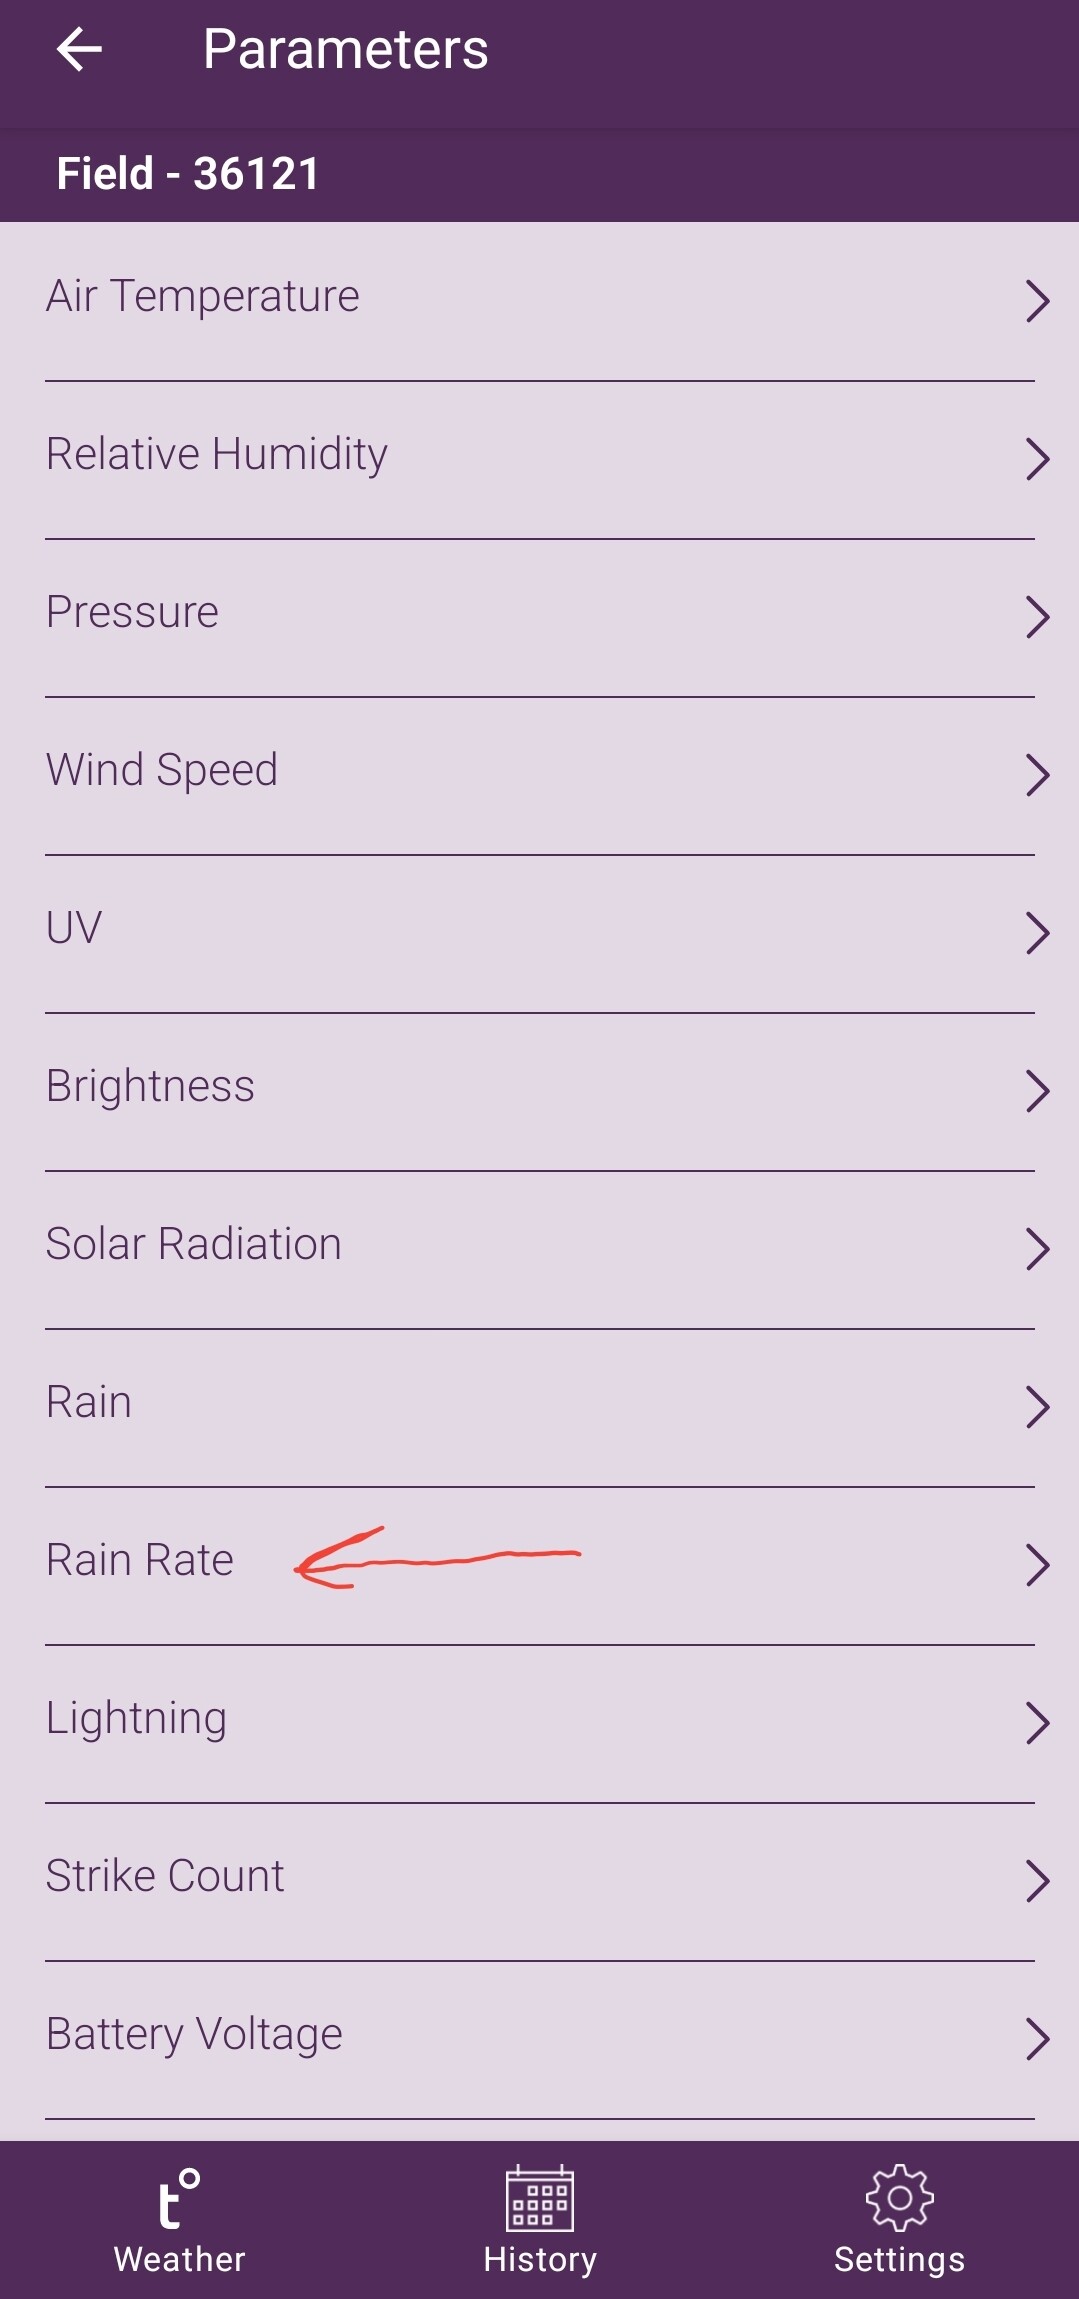
It shows actually rain rates rather than binned values.
I’d like to try that but I cannot seem to find that setting.

Got it thanks for the instructions, learning all the time.
This topic was automatically closed 365 days after the last reply. New replies are no longer allowed.