This is a general question with regards to standardization work done at weatherflow.
On the websites like ikitesurf, sailflow or iwindsurf, when you view live wind stations are they all displaying the same average wind speed? That is do you guys covert all the readings to 10 minute or 2 minute average, or are all the wind stations displaying averages based on various intervals?
Additionally, the wind forecasts produced on the above websites, are they all standardized as well? That is quicklook, GFS, NAM, HRRR all display instantaneous values, specific time average interval et cetera?
weatherflow display instantaneous (taken every 3 seconds or every 15 seconds) and 1 minute averages. The graph averages the values more when you zoom out. (5 minutes, 30 minutes, 3 hours, and daily averages )
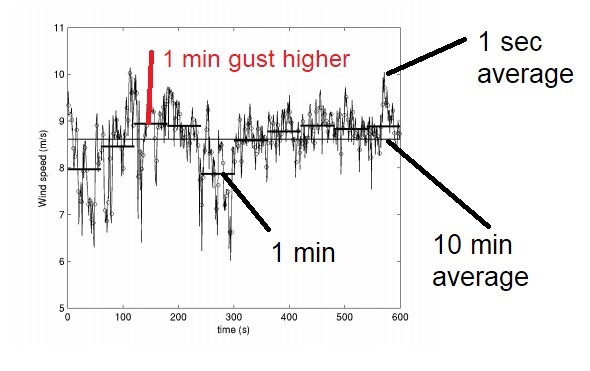
also interesting in relation to wind gusts (but not for weatherflow system): “in the U.S., maximum sustained winds are always measured by anemometers at a standard height of 33 feet (10 m) above ground for a duration of 1 minute. The rest of the world averages their winds over a period of 10 minutes. This difference is significant because measurements averaged over just one minute are about 14% higher than those averaged over the course of ten minutes.”
Weatherflow’s graphs use a very weird definition of wind gust or lull, as it takes the maximum or minimum over whatever zoom level is chosen. That’s weird, because it changes the value while zooming in/out. This results for example in a wind lull graph that is nearly always a flat zero when zoomed out to the daily level. In my opinion that shouldn’t happen. What should happen is that they take some definition of wind gust/lull. calculate those values, and when zooming out, take the average of those values, instead of the min/max of those values. That would preserve the gust/lull measurements.
For the sake of conversation, I’ll share our expert’s comments on this claim…
This is incorrect. It’s not that the winds are stronger, but that the sampling technique is important and shorter averaging times can be interpreted as stronger if care is not taken.
Measurements of mean wind speed taken over 1-min or 10-min are equally valid estimators of the mean. Both means are statistically equivalent in that, if you take enough measurements of the mean wind and the winds are steady of time, then they will average out to be the same mean wind speed.
However, if you look at a series of 1-min averages in a 10-min period, some will be higher and some lower than the 10-min mean. Wind records show that the highest 1-min average in a 10-min period is 21% higher than the 10-min mean over land (grassland) and 11% higher with winds coming off the water (beach). If a time series of 1-min averages are plotted, humans tend to choose the maximum 1-min reading as the average, which is a biased estimation.
1-min averaging is not that common on the US. ASOS stations use a 2-min average, but they are the exception. Most federal networks have longer averaging periods. 1-min is more common in non-federal networks. WeatherFlow uses 2 averaging periods… 5-min for consumer apps and 1-min for insurance clients. The 1-min data is generally too noisy (variable) for consumer apps, but is strongly tied to wind storm damage statistics, and so is favored by the insurance industry.
Here’s a good reference…
GUIDELINES FOR CONVERTING BETWEEN VARIOUS WIND AVERAGING PERIODS IN TROPICAL CYCLONE CONDITIONS - https://www.wmo.int/pages/prog/www/tcp/documents/WMO_TD_1555_en.pdf
Marty Bell, Ph.D. - Director, Research & Modeling
hey sunny, thanks for replies, I am aware about smart weather station displaying 1 minute average,
during your second post you got at the heart of the problem that I am implying here. From what I discovered it looks like wind observations and wind forecasts are a giant mess as they all rely on different average intervals.
with regards to wind observations, National Hurricane Center uses 1 minute average as well as WF smart weather station. National Weather Service uses 2 minute average wind speeds and so does ASOS and AWOS stations in the airports. Rest of the world is using 10 minute average for most part, with some countries like India are using 3 minute average.
With regards to forecasts things get even weirder as I emailed data scientists at GFS and NAM models and they told me that they only produce instantaneous values, not averages. Which means that you cant compare the numbers on forecast tables to the numbers that are observed at wind sensors.
I am hoping WF can clarify on it, I already emailed Tim before, but he did not know the answer.
What is even weirder that sites like sailflow, windfinder, wundergraound, predict wind, have different values from same model run for same location for same model. Maybe it is the way they interpolate the data?
As far as wind speed, the model output is giving an instantaneous value.
I don’t believe we are post-processing any data from non-proprietary models, i.e. GFS, NAM, HRRR, etc.
This quote was taken with respect to wind gusts, not average wind speed. For average wind speed you are right. For wind gust, it definitely matters and the maximum is different.
Not that it would be an apples to oranges comparison as we are still talking about comparing wind speed. The difference is that time comes into play with observed values and that needs to be taken into account.
after reading part of your linked info, I think we can agree, that for average windspeed, the interval isn’t influencing the correct measurement, just that a longer interval makes the variation in reported values bigger, not the value itself.
Also for wind gusts, it definitely matters. Taken the max value during a 1 minute interval will in general be lower than the max value during a 10 minute interval. I think we agree on that as well.
What I don’t like is that when you take some definition of gust (say the max during 1 minute) you could store those values. Those are the gust values. When graphing those, the graph should try to represent those values, but weatherflow’s graphs don’t. They change the value.
no, if you measure continuously for 1 minute and take the max, that max is lower than when you take the max of a continuous 10 minute measuring interval.
Okay there might be some differences with the Smart Weather app graphs at different zoom levels versus averaging techniques. The data on the Smart Weather app graphs is manipulated/formatted to fit the allotted space in the graph. Regardless the highest gust in a certain time frame should be preserved.
this is where the remark of weatherflow staf’s expert come into play. When you are trying to measure the average wind speed, the sampling interval is not much of a factor in the correct value (as long as a sample is defined as a single windspeed measurement taken every 1 second, or one minute, or 10 minutes). They all represent the real windspeed. But by taking 1 second measurement as in your graph, you just get more measurements. That looks more noisy, but isn’t (it might be due to other factors, but not due to sampling). Of course having many more samples and averaging those, will produce a value that is closer to the real wind speed.
But that’s true for average wind speed.
Wind gust, could be defined as the max true wind during some period, say 10 minutes. The maximum behaves differently.
lets use a dice as an example. You throw the dice once per second. Every minute you calculate the average. (will be close to 3.5). You could report those as the average dice value. You could do that 10 times (for 10 minutes) and average those. You still get a value around 3.5, but closer to 3.5.
Instead I could just throw the dice one every minute and average those. it will be close to 3.5 but not as close as the 10 minutes measurement done before.
The max is different. If you roll the dice once per second and calculate the average (just as before). you will get something close to 3.5. do that 10 times and take the max. you will get something close to 3.5 but it will be higher. Compare that to rolling the dice once per second during one minute and take the max. That is most likely 6. (not always). do that 10 times and average those and you will end up something close to 6, even higher when taken the max of those 10 times.
the problem is that the ‘certain time frame’ changes when zooming out. Therefore the values cannot be compared at different zoom levels. That’s why the wind lull is almost always zero when zoomed out.
just spent sometime reading ECMWF manual, and it actually has a warning that care should be taken when comparing model outputs to observation due to time intervals varying on scale (see image attached). Also looks that all models always output instantaneous values for wind speed due to the fact that model has just an average for a grid size and has zero time scale variability. More on it here https://confluence.ecmwf.int/display/CKB/Parameters+valid+at+the+specified+time
basically it is just telling you the forecasts can differ from actual measurements due to all kind of factors. Most notably the forecasts don’t know about your hyper local situations.