I would find a wind chill (Feels Like) reading on the display, to be useful.
Not every country calculates windchill in the same manner though.
This already exists in the “Feels Like” temperature. Depending on the temperature/wind speed/humidity, the “Feels Like” temperature will either show the wind chill or the heat index. The equations used to calculate both values can be seen here: https://weatherflow.github.io/SmartWeather/api/derived-metric-formulas.html
I’m guessing he meant on the front default display of the app without having to hit the icon in the upper right. I too think it would be a nice feature to have without having to hit that icon.
He made two statements, both which are non-specific.
I believe when the conditions are such that the Feels Like temperature differs from the ambient temperature, the Feels Like temperature is displayed on the front default display instead of the dew point.
Hi @valkatove,
There are some fields which are not obvious to find…
To view more calculated fields from my browser view I click on  which displays a list like:

Or if I click my station on the map OR another station it also brings up a list that looks like:
And from there I can click the station name to ‘goto’ that station.
Cheers Ian

Thank you for the responses.
I have never come across a “Feels Like” on the display or in the back ground.
Though the winter has been warm, the times when it has been minus 27 with some wind I have never noticed a “Feels Like” on the display.
I will check closer next time.
Pete, I’ve never seen the ‘Feels Like’ field on the front display. It’s always Temp-Dew Point-Humidity, regardless of the wind & temperature.
I’ve certainly had windy conditions where the ‘feel like’ temp would differ from the ambient temp. So I’m not sure if that’s a setting I haven’t enabled, but I don’t see anything that would toggle DP to ‘Feels Like’. The only way I’ve found to get that is to hit the upper left icon and go to ‘Current Conditions’.
It is certainly not a setting you can toggle. I always assumed it automatically switched, but I think you may be right - it is fixed on Temp-Dew Point-Humidity. Perhaps this is something WF will get to in due course.
Pete, that would be great!
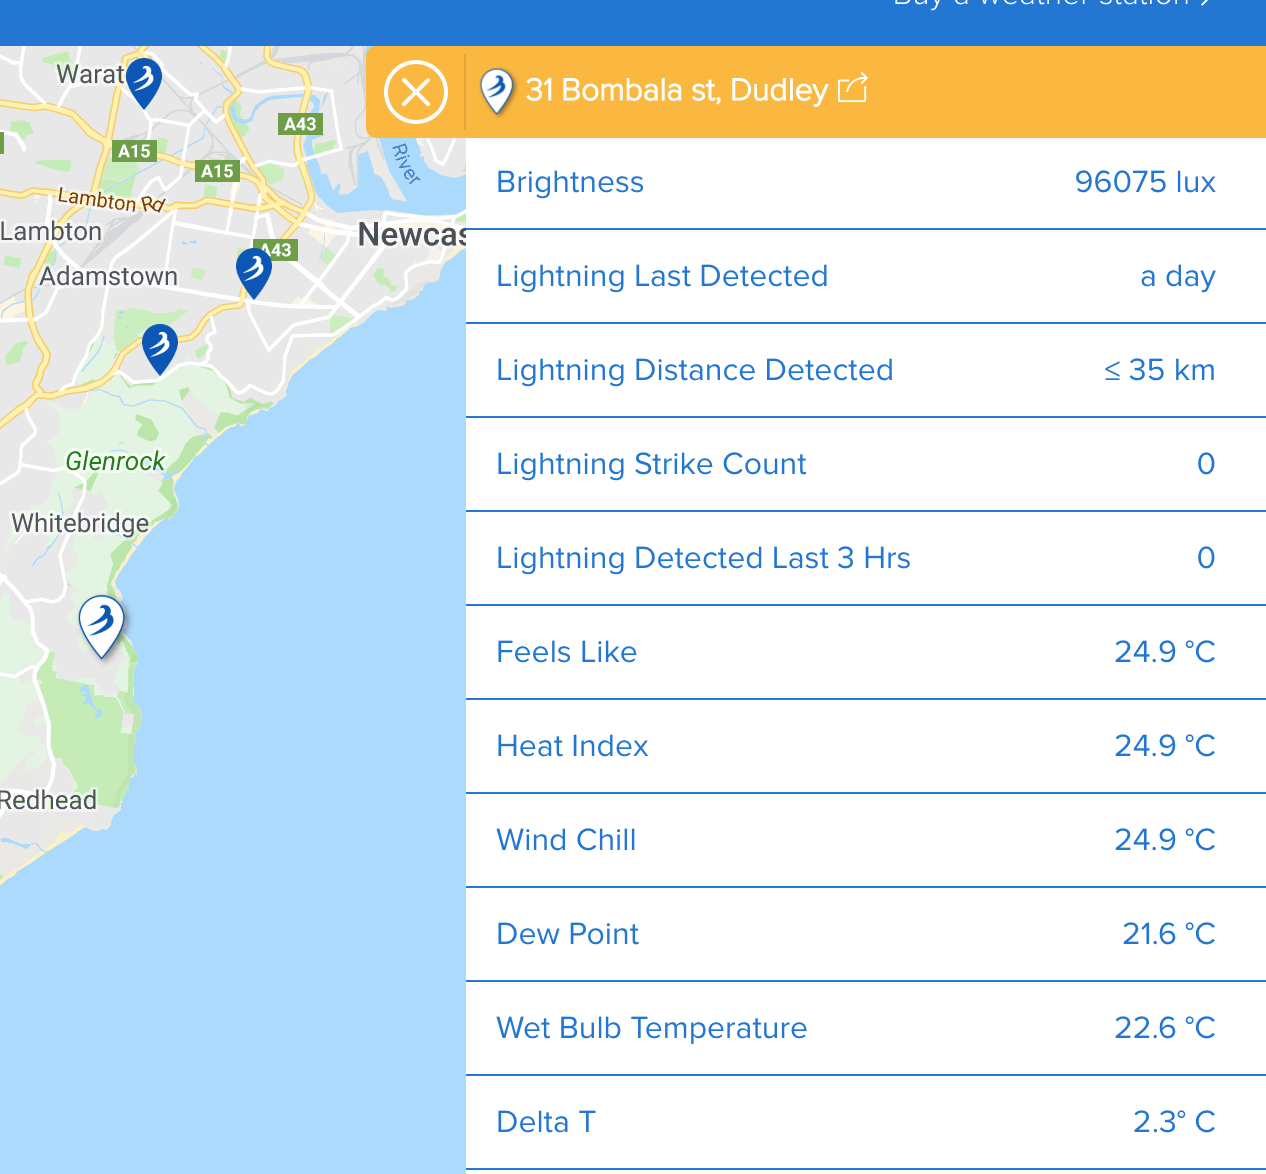
I would like to have the wind chill / heat index visible here :

I too would like to have the option to always see dew point in the main card display. It’s just now become warm enough here that my display has replaced dew point with “Feels Like”. I like having feels like and wind chill when called for, but would like to be able to toggle to have them replace RH instead of dew point if all three can’t be displayed.
Thanks for your consideration.
Is there a description somewhere of when/under precisely which conditions the “wind_chill” and “feels like” data will be present?
Check out the descriptions in the Derived Metrics:
Thank you. This appears to explain how the value is calculated. My actual question (which I was not clear about) should have been stated as:
Sometimes the feels-like and wind-chill data is available in the api call but sometimes they are not present. Is there a description somewhere of what are the conditions that trigger the data being present?
(I do not see an answer yo this question in the link that was given…?
Or maybe what is being said is:
-
since “The Feels Like temperature is equal to the Heat Index if the temperature is at or above 80°F” -> when temp >= 80 degrees F then the there will be no “Feels Like” values, instead there will be a “Heat Index” value…? or is it saying that there will be a “feels like” and it will be equal to the “Heat Index”?
-
since: " Feels Like temperature is equal to “Wind Chill” if the temperature is at or below 50°F and wind speeds are above 3mph" -> if temp <= 50 degrees F and windspeed > 3mph then there will be a “feels like” and it will be equal to the “wind chill” …?
-
for the other cases there will be no “feels like”…?
So right now, for my device, the temp is 30 degrees F, but the wind is 0.7 mph, so there is no “feels like” value… hmm… maybe the above is correct…?
amazingly, and I never noticed this before, but I don’t see a way to read back the wind speed…? It’s there in the web app but not in the json data from the api…?
Yes, you are right with the above.
When the temperature is >= 80F AND humidity is >= 40% the “Feels Like” temperature will be equal to the heat index.
When the temperature is <= 50F AND wind speed > 3 mph the “Feels Like” temperature will be equal to the wind chill.
For all values in between the “Feels Like” temperature will be equal to the observed temperature (and will not be shown in the app).
The one-minute average wind speeds, wind lull and wind gust are available in the API. For the Tempest they are indexes 1,2 & 3 in the JSON obs array and for the Sky they are indexes 4, 5 & 6 in the JSON obs array. The three second rapid wind updates are only available via the Websocket. You can see more details here: Tempest API (click expand operations in the top right) and here: WeatherFlow Tempest API Websocket Reference
Thank you, Peter!!!
Actually, when I run the request that I’ve been using I now see the “feels like” and I see “wind avg” (which was not there before)… so apparently the weather conditions are now correct to show the feels like and the wind chill.
I’m trying to run the request that you pointed me to. (I found that I had to add my access token, which I do not see a way to do in the web app.)
I guess that I’m still confused about how these things need to be done.
When I run:
https://swd.weatherflow.com/swd/rest/stations?token=###
I see:
{
“location_item_id”:109693,
“location_id”:12797,
“device_id”:44665,
“item”:“wind”,
“sort”:0,
“station_id”:12797,
“station_item_id”:109693
}
so does this mean that I can access the “wind” data (as you described?) ?
I tried using device_id=44665
as:
https://swd.weatherflow.com/swd/rest/observations/device/44665&token=###
but the returned data looks the same as it usually does and does not seem to be the “wind” data…?
(I’m using curl b/c it does not seem like the web app interface has a way to specify the token.)
(Also, even though the json says that temperature values are in degrees F, the “feels like” and “wind chill” values appear to be in C…?)
@erholp, it can take some time to get familiar with the API, but I guarantee that all the data is there!
There are a couple of different API endpoints, and it might be helpful to quickly explain the differences. The first is the “station” endpoint. This returns the meta data associated with your station like location, latitude, longitude, elevation etc. and a bunch of diagnostic information that isn’t particularly useful outside of the WF app. It doesn’t contain any observations. You can access this endpoint using this URL (replace the xxx with your own Personal Access Token):
https://swd.weatherflow.com/swd/rest/stations?token=xxx
You can enter this URL into any browser as well - you don’t just have to use Curl. It uses your Personal Access Token to find all the different stations associated with your account (which can be one or more).
The second endpoint is the “observation” endpoint. This endpoint is split into two by “station” and “device” - i.e. you can access all observations associated with a station, or all observations associated with a device.
For a device observation, the URL you need is:
https://swd.weatherflow.com/swd/rest/observations/device/xxx?token=xxx
You need to replace the first set of xxx’s with a device ID for your Tempest (or Air or Sky) and the second set with your Personal Access Token. For my Tempest device, the response looks like:
{"status":{"status_code":0,"status_message":"SUCCESS"},
"device_id":90741,"type":"obs_st","source":"cache",
"summary":{"pressure_trend":"steady","strike_count_1h":0,"strike_count_3h":0,"precip_total_1h":0.0,"strike_last_dist":24,"strike_last_epoch":1606138162,"precip_accum_local_yesterday":0.448314,"precip_analysis_type_yesterday":0,"feels_like":7.7,"heat_index":7.7,"wind_chill":7.7},
"obs":[[1607680308,0,0,0,null,60,977.1,7.7,100,7199,0.13,60,0,0,0,0,2.36,1,7.467595,null,null,0]]}
The most useful bit is the "obs" array. This contains all the latest device observations (including wind in indexes 1, 2, and 3). You can see what each number is in the link I shared above: https://weatherflow.github.io/Tempest/api/swagger/ (click expand operations in the top right) along with the units. For this API endpoint the observations units are always in metric irrespective of what you have set in the app - it is up to you to convert them to your units of choice.
For a station observation the you URL you need is:
https://swd.weatherflow.com/swd/rest/observations/station/xxx?token=xxx
This time you need to replace the first set of xxx’s with a Station ID and the second set with your Personal Access Token. The output from this endpoint is more verbose, and contains derived variables such as Feels Like temperature, wind chill and heat index. Here is an example from my Tempest
{
  "station_id": 27648,
  "station_name": "Cambourne-Tempest",
  "public_name": "Cambourne-Test",
  "latitude": 52.21916,
  "longitude": -0.05568,
  "timezone": "Europe/London",
  "elevation": 71.6,
  "is_public": true,
  "status": {
    "status_code": 0,
    "status_message": "SUCCESS"
  },
  "station_units": {
    "units_temp": "c",
    "units_wind": "mph",
    "units_precip": "mm",
    "units_pressure": "hpa",
    "units_distance": "km",
    "units_direction": "cardinal",
    "units_other": "metric"
  },
  "outdoor_keys": [
    "timestamp",
    "air_temperature",
    "barometric_pressure",
    "station_pressure",
    "pressure_trend",
    "sea_level_pressure",
    "relative_humidity",
    "precip",
    "precip_accum_last_1hr",
    "precip_accum_local_day",
    "precip_accum_local_yesterday",
    "precip_minutes_local_day",
    "precip_minutes_local_yesterday",
    "wind_avg",
    "wind_gust",
    "wind_lull",
    "solar_radiation",
    "uv",
    "brightness",
    "lightning_strike_last_epoch",
    "lightning_strike_last_distance",
    "lightning_strike_count",
    "lightning_strike_count_last_1hr",
    "lightning_strike_count_last_3hr",
    "feels_like",
    "heat_index",
    "wind_chill",
    "dew_point",
    "wet_bulb_temperature",
    "delta_t",
    "air_density"
  ],
  "obs": [
    {
      "timestamp": 1607680428,
      "air_temperature": 7.7,
      "barometric_pressure": 977.2,
      "station_pressure": 977.2,
      "sea_level_pressure": 985.9,
      "relative_humidity": 100,
      "precip": 0,
      "precip_accum_last_1hr": 0,
      "precip_accum_local_day": 7.467595,
      "precip_accum_local_yesterday": 0.448314,
      "precip_minutes_local_day": 199,
      "precip_minutes_local_yesterday": 21,
      "wind_avg": 0,
      "wind_gust": 0,
      "wind_lull": 0,
      "solar_radiation": 67,
      "uv": 0.16,
      "brightness": 8056,
      "lightning_strike_last_epoch": 1606138162,
      "lightning_strike_last_distance": 24,
      "lightning_strike_count": 0,
      "lightning_strike_count_last_1hr": 0,
      "lightning_strike_count_last_3hr": 0,
      "feels_like": 7.7,
      "heat_index": 7.7,
      "wind_chill": 7.7,
      "dew_point": 7.7,
      "wet_bulb_temperature": 7.8,
      "delta_t": -0.1,
      "air_density": 1.2121,
      "pressure_trend": "steady"
    }
  ]
}
The station units refer to the unit choices you have made in the app. I don’t use this endpoint that frequently (I tend to use the device observation endpoint), so I am not clear whether the observations in this endpoint are in metric or respect the choice of units you made in the app. If you are using F instead of C for temperature though, this should be pretty clear.
Anyway, hopefully this helps a little for understanding where you can get all the data. It is definitely there!